HAF018). A specific band was detected for P-Cadherin at approximately 120 kDa (as indicated). This experiment was conducted under reducing conditions and using
Immunoblot Buffer Group 1." class="big_lightbox">
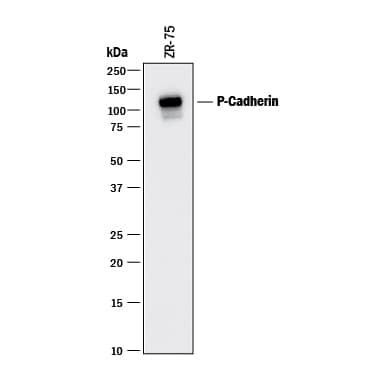
HAF018). A specific band was detected for P-Cadherin at approximately 120 kDa (as indicated). This experiment was conducted under reducing conditions and using
Immunoblot Buffer Group 1." alt="Western blot shows lysate of ZR-75 human breast cancer cell line. PVDF membrane was probed with 1 µg/mL of Mouse Anti-Human P-Cadherin Monoclonal Antibody (Catalog # MAB861) followed by HRP-conjugated Anti-Mouse IgG Secondary Antibody (Catalog #
HAF018). A specific band was detected for P-Cadherin at approximately 120 kDa (as indicated). This experiment was conducted under reducing conditions and using
Immunoblot Buffer Group 1." class="big_thumb" />
MAB002, open histogram), followed by Allophycocyanin-conjugated Anti-Mouse IgG F(ab')2 Secondary Antibody (Catalog #
F0101B). Cells were stained in a buffer containing Ca2+ and Mg2+. View our protocol for
Staining Membrane-associated Proteins." class="big_lightbox">
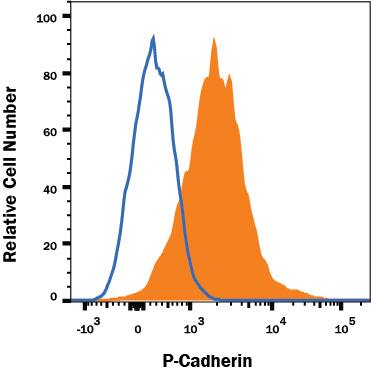
MAB002, open histogram), followed by Allophycocyanin-conjugated Anti-Mouse IgG F(ab')2 Secondary Antibody (Catalog #
F0101B). Cells were stained in a buffer containing Ca2+ and Mg2+. View our protocol for
Staining Membrane-associated Proteins." class="big_thumb" />
HAF018). A specific band was detected for P-Cadherin at approximately 150 kDa (as indicated) in the parental A431 cell line, but is not detectable in knockout A431 cell line. GAPDH (Catalog #
MAB5718) is shown as a loading control. This experiment was conducted under reducing conditions and using
Immunoblot Buffer Group 1." class="big_lightbox">
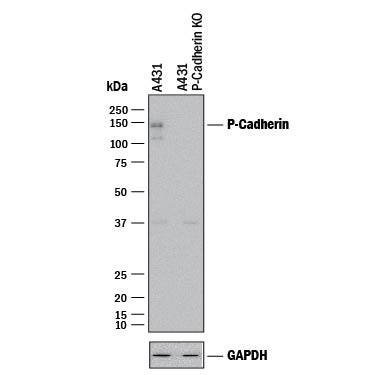
HAF018). A specific band was detected for P-Cadherin at approximately 150 kDa (as indicated) in the parental A431 cell line, but is not detectable in knockout A431 cell line. GAPDH (Catalog #
MAB5718) is shown as a loading control. This experiment was conducted under reducing conditions and using
Immunoblot Buffer Group 1." class="big_thumb" />
MAB002, open histogram) followed by anti-Mouse IgG PE-conjugated Secondary Antibody (Catalog #
F0102B). No staining in the P-Cadherin knockout A431 cell line was observed. Cells were stained in a buffer containing Ca2+ and Mg2+. View our protocol for
Staining Membrane-associated Proteins." class="big_lightbox">
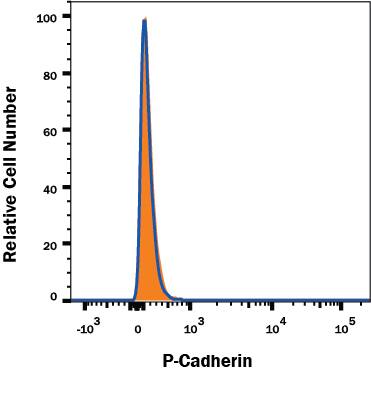
MAB002, open histogram) followed by anti-Mouse IgG PE-conjugated Secondary Antibody (Catalog #
F0102B). No staining in the P-Cadherin knockout A431 cell line was observed. Cells were stained in a buffer containing Ca2+ and Mg2+. View our protocol for
Staining Membrane-associated Proteins." class="big_thumb" />
861-PC) was serially diluted and captured by Mouse Anti-Human P‑Cadherin Monoclonal Antibody (Catalog # MAB861) coated on a Clear Polystyrene Microplate (Catalog #
DY990). Goat Anti-Human P‑Cadherin Antigen Affinity-purified Polyclonal Antibody (Catalog #
AF861) was biotinylated and incubated with the protein captured on the plate. Detection of the standard curve was achieved by incubating Streptavidin-HRP (Catalog #
DY998)" class="big_lightbox">

861-PC) was serially diluted and captured by Mouse Anti-Human P‑Cadherin Monoclonal Antibody (Catalog # MAB861) coated on a Clear Polystyrene Microplate (Catalog #
DY990). Goat Anti-Human P‑Cadherin Antigen Affinity-purified Polyclonal Antibody (Catalog #
AF861) was biotinylated and incubated with the protein captured on the plate. Detection of the standard curve was achieved by incubating Streptavidin-HRP (Catalog #
DY998)" class="big_thumb" />
 HAF018). A specific band was detected for P-Cadherin at approximately 120 kDa (as indicated). This experiment was conducted under reducing conditions and using Immunoblot Buffer Group 1." alt="Western blot shows lysate of ZR-75 human breast cancer cell line. PVDF membrane was probed with 1 µg/mL of Mouse Anti-Human P-Cadherin Monoclonal Antibody (Catalog # MAB861) followed by HRP-conjugated Anti-Mouse IgG Secondary Antibody (Catalog # HAF018). A specific band was detected for P-Cadherin at approximately 120 kDa (as indicated). This experiment was conducted under reducing conditions and using Immunoblot Buffer Group 1." class="big_thumb" />
 HAF017). A specific band was detected for P-Cadherin at approximately 120 kDa (as indicated). This experiment was conducted under reducing conditions and using Immunoblot Buffer Group 1." alt="Western blot shows lysate of ZR-75 human breast cancer cell line. PVDF membrane was probed with 1 µg/mL of Goat Anti-Human P-Cadherin Antigen Affinity-purified Polyclonal Antibody (Catalog # AF861) followed by HRP-conjugated Anti-Goat IgG Secondary Antibody (Catalog # HAF017). A specific band was detected for P-Cadherin at approximately 120 kDa (as indicated). This experiment was conducted under reducing conditions and using Immunoblot Buffer Group 1." class="big_thumb" />


 MAB002, open histogram), followed by Allophycocyanin-conjugated Anti-Mouse IgG F(ab')2 Secondary Antibody (Catalog #
  NL007) and counterstained with DAPI(blue). Specific staining was localized to the cell surface. View our protocol for
 HAF018). A specific band was detected for P-Cadherin at approximately 150 kDa (as indicated) in the parental A431 cell line, but is not detectable in knockout A431 cell line. GAPDH (Catalog #
  MAB002, open histogram) followed by anti-Mouse IgG PE-conjugated Secondary Antibody (Catalog #
  NL007) and counterstained with DAPI (blue). Specific staining was localized to plasma membrane in wildtype cells. View our protocol for
  861-PC) was serially diluted and captured by Mouse Anti-Human P‑Cadherin Monoclonal Antibody (Catalog # MAB861) coated on a Clear Polystyrene Microplate (Catalog #
 ![Western Blot: P-Cadherin Antibody (OTI2D5) [NBP2-45601] - Analysis of HEK293T cells were transfected with the pCMV6-ENTRY control (Left lane) or pCMV6-ENTRY P-Cadherin.](http://images.novusbio.com/fullsize/P-Cadherin-Antibody-OTI2D5-Western-Blot-NBP2-45601-img0009.jpg "Western Blot: P-Cadherin Antibody (OTI2D5) [NBP2-45601] - Analysis of HEK293T cells were transfected with the pCMV6-ENTRY control (Left lane) or pCMV6-ENTRY P-Cadherin.")
![Immunohistochemistry: P-Cadherin Antibody (OTI2D5) [NBP2-45601] - Analysis of Human lymph node tissue. (Heat-induced epitope retrieval by 10mM citric buffer, pH6.0, 120C for 3min)](http://images.novusbio.com/fullsize/P-Cadherin-Antibody-OTI2D5-Immunohistochemistry-NBP2-45601-img0008.jpg)
![Immunohistochemistry: P-Cadherin Antibody (OTI2D5) [NBP2-45601] - Analysis of Adenocarcinoma of Human colon tissue. (Heat-induced epitope retrieval by 10mM citric buffer, pH6.0, 120C for 3min)](http://images.novusbio.com/fullsize/P-Cadherin-Antibody-OTI2D5-Immunohistochemistry-NBP2-45601-img0003.jpg)
![Immunohistochemistry: P-Cadherin Antibody (OTI2D5) [NBP2-45601] - Analysis of Adenocarcinoma of Human endometrium tissue. (Heat-induced epitope retrieval by 10mM citric buffer, pH6.0, 120C for 3min)](http://images.novusbio.com/fullsize/P-Cadherin-Antibody-OTI2D5-Immunohistochemistry-NBP2-45601-img0004.jpg)
![Immunohistochemistry: P-Cadherin Antibody (OTI2D5) [NBP2-45601] - Analysis of Adenocarcinoma of Human breast tissue. (Heat-induced epitope retrieval by 10mM citric buffer, pH6.0, 120C for 3min)](http://images.novusbio.com/fullsize/P-Cadherin-Antibody-OTI2D5-Immunohistochemistry-NBP2-45601-img0005.jpg)
![Immunohistochemistry: P-Cadherin Antibody (OTI2D5) [NBP2-45601] - Analysis of Carcinoma of Human lung tissue.(Heat-induced epitope retrieval by 10mM citric buffer, pH6.0, 120C for 3min)](http://images.novusbio.com/fullsize/P-Cadherin-Antibody-OTI2D5-Immunohistochemistry-NBP2-45601-img0006.jpg)
![Immunohistochemistry: P-Cadherin Antibody (OTI2D5) [NBP2-45601] - Analysis of Human lymphoma tissue. (Heat-induced epitope retrieval by 10mM citric buffer, pH6.0, 120C for 3min)](http://images.novusbio.com/fullsize/P-Cadherin-Antibody-OTI2D5-Immunohistochemistry-NBP2-45601-img0007.jpg)
![Immunofluorescence: P-Cadherin Antibody (OTI2D5) [NBP2-45601] - Analysis of COS7 cells transiently transfected by pCMV6-ENTRY P-Cadherin.](http://images.novusbio.com/fullsize/P-Cadherin-Antibody-OTI2D5-Immunofluorescence-NBP2-45601-img0001.jpg)
![Immunofluorescence: P-Cadherin Antibody (OTI2D5) [NBP2-45601] - Analysis of HeLa cells.](http://images.novusbio.com/fullsize/P-Cadherin-Antibody-OTI2D5-Immunofluorescence-NBP2-45601-img0002.jpg)

![Western Blot: P-Cadherin Antibody [NBP1-59222] - Suggested Anti-CDH3 Antibody Titration: 1.25ug/ml Positive Control: HepG2 cell lysate](http://images.novusbio.com/fullsize/P-Cadherin-Antibody-Western-Blot-NBP1-59222-img0001.jpg "Western Blot: P-Cadherin Antibody [NBP1-59222] - Suggested Anti-CDH3 Antibody Titration: 1.25ug/ml Positive Control: HepG2 cell lysate")
![Immunohistochemistry-Paraffin: P-Cadherin Antibody [NBP1-59222] - Human Kidney](http://images.novusbio.com/fullsize/P-Cadherin-Antibody-Immunohistochemistry-Paraffin-NBP1-59222-img0002.jpg)


![Immunohistochemistry-Paraffin: P-Cadherin Antibody [NBP1-85707] - Analysis in human skin and skeletal muscle tissues. Corresponding CDH3 RNA-seq data are presented for the same tissues.](http://images.novusbio.com/fullsize/P-Cadherin-Antibody-Immunohistochemistry-Paraffin-NBP1-85707-img0008.jpg "<b>Orthogonal Strategies Validation. </b>Immunohistochemistry-Paraffin: P-Cadherin Antibody [NBP1-85707] - Analysis in human skin and skeletal muscle tissues. Corresponding CDH3 RNA-seq data are presented for the same tissues.")
![<b>Orthogonal Strategies Validation. </b>Immunohistochemistry-Paraffin: P-Cadherin Antibody [NBP1-85707] - Staining of human skin shows moderate membranous positivity in squamous epithelial cells.](http://images.novusbio.com/fullsize/P-Cadherin-Antibody-Immunohistochemistry-Paraffin-NBP1-85707-img0011.jpg)
![Immunohistochemistry-Paraffin: P-Cadherin Antibody [NBP1-85707] - Staining of human colon shows weak membranous positivity in glandular cells.](http://images.novusbio.com/fullsize/P-Cadherin-Antibody-Immunohistochemistry-Paraffin-NBP1-85707-img0009.jpg)
![Immunohistochemistry-Paraffin: P-Cadherin Antibody [NBP1-85707] - Staining of human skeletal muscle shows no membranous positivity in myocytes as expected.](http://images.novusbio.com/fullsize/P-Cadherin-Antibody-Immunohistochemistry-Paraffin-NBP1-85707-img0010.jpg)
![Immunohistochemistry-Paraffin: P-Cadherin Antibody [NBP1-85707] - Staining of human placenta shows moderate membranous positivity in trohoblastic cells.](http://images.novusbio.com/fullsize/P-Cadherin-Antibody-Immunohistochemistry-Paraffin-NBP1-85707-img0012.jpg)

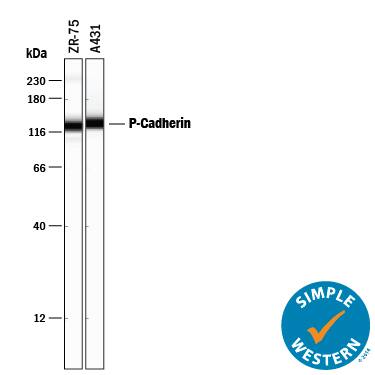
 HAF109). This experiment was conducted under reducing conditions and using the 12-230 kDa separation system." class="big_thumb" />
 861-PC) was serially diluted and captured by Mouse Anti-Human P‑Cadherin Monoclonal Antibody (Catalog #


