HAF017). Specific bands were detected for PD-1 at approximately 40-50 kDa (as indicated). This experiment was conducted under reducing conditions and using
Immunoblot Buffer Group 1." class="big_lightbox">
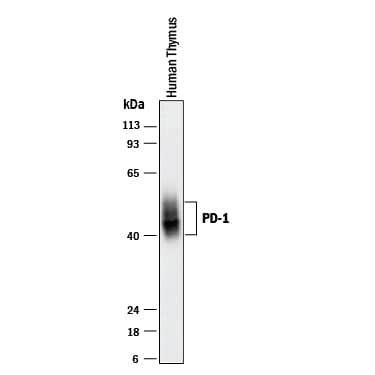
HAF017). Specific bands were detected for PD-1 at approximately 40-50 kDa (as indicated). This experiment was conducted under reducing conditions and using
Immunoblot Buffer Group 1." alt="Western blot shows lysate of human thymus tissue. PVDF membrane was probed with 2 µg/mL of Goat Anti-Human PD-1 Antigen Affinity-purified Polyclonal Antibody (Catalog # AF1086) followed by HRP-conjugated Anti-Goat IgG Secondary Antibody (Catalog #
HAF017). Specific bands were detected for PD-1 at approximately 40-50 kDa (as indicated). This experiment was conducted under reducing conditions and using
Immunoblot Buffer Group 1." class="big_thumb" />
HAF017). Specific bands were detected for PD-1 at approximately 40-80 kDa (as indicated). This experiment was conducted under reducing conditions and using
Immunoblot Buffer Group 1." class="big_lightbox">
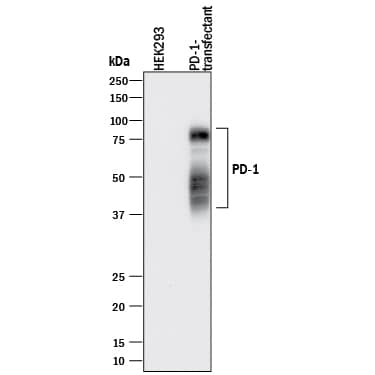
HAF017). Specific bands were detected for PD-1 at approximately 40-80 kDa (as indicated). This experiment was conducted under reducing conditions and using
Immunoblot Buffer Group 1." class="big_thumb" />


AF1086) at 1ug/mL with overnight incubation at 4 degrees Celsius followed by incubation with anti-goat IgG VisUCyte HRP Polymer Antibody (Catalog #
VC004) and DAB chromogen (yellow-brown). Tissue was counterstained with hematoxylin (blue). Specific staining was localized to cell surface. " class="big_lightbox">

AF1086) at 1ug/mL with overnight incubation at 4 degrees Celsius followed by incubation with anti-goat IgG VisUCyte HRP Polymer Antibody (Catalog #
VC004) and DAB chromogen (yellow-brown). Tissue was counterstained with hematoxylin (blue). Specific staining was localized to cell surface. " class="big_thumb" />
1086-PD) was serially diluted and captured by Goat Anti-Human PD‑1 Antigen Affinity-purified Polyclonal Antibody (Catalog # AF1086) coated on a Clear Polystyrene Microplate (Catalog #
DY990). Goat Anti-Human PD‑1 Antigen Affinity-purified Polyclonal Antibody (Catalog #
AF1086) was biotinylated and incubated with the protein captured on the plate. Detection of the standard curve was achieved by incubating Streptavidin-HRP (Catalog #
DY998)" class="big_lightbox">

1086-PD) was serially diluted and captured by Goat Anti-Human PD‑1 Antigen Affinity-purified Polyclonal Antibody (Catalog # AF1086) coated on a Clear Polystyrene Microplate (Catalog #
DY990). Goat Anti-Human PD‑1 Antigen Affinity-purified Polyclonal Antibody (Catalog #
AF1086) was biotinylated and incubated with the protein captured on the plate. Detection of the standard curve was achieved by incubating Streptavidin-HRP (Catalog #
DY998)" class="big_thumb" />
1086-PD) was serially diluted and captured by Goat Anti-Human PD‑1 Antigen Affinity-purified Polyclonal Antibody (Catalog #
AF1086) coated on a Clear Polystyrene Microplate (Catalog #
DY990). Goat Anti-Human PD‑1 Antigen Affinity-purified Polyclonal Antibody (Catalog # AF1086) was biotinylated and incubated with the protein captured on the plate. Detection of the standard curve was achieved by incubating Streptavidin-HRP (Catalog #
DY998)" class="big_lightbox">

1086-PD) was serially diluted and captured by Goat Anti-Human PD‑1 Antigen Affinity-purified Polyclonal Antibody (Catalog #
AF1086) coated on a Clear Polystyrene Microplate (Catalog #
DY990). Goat Anti-Human PD‑1 Antigen Affinity-purified Polyclonal Antibody (Catalog # AF1086) was biotinylated and incubated with the protein captured on the plate. Detection of the standard curve was achieved by incubating Streptavidin-HRP (Catalog #
DY998)" class="big_thumb" />
 HAF017). Specific bands were detected for PD-1 at approximately 40-50 kDa (as indicated). This experiment was conducted under reducing conditions and using Immunoblot Buffer Group 1." alt="Western blot shows lysate of human thymus tissue. PVDF membrane was probed with 2 µg/mL of Goat Anti-Human PD-1 Antigen Affinity-purified Polyclonal Antibody (Catalog # AF1086) followed by HRP-conjugated Anti-Goat IgG Secondary Antibody (Catalog # HAF017). Specific bands were detected for PD-1 at approximately 40-50 kDa (as indicated). This experiment was conducted under reducing conditions and using Immunoblot Buffer Group 1." class="big_thumb" />
 HAF017). A specific band was detected for PD-1 at approximately 55 kDa (as indicated). This experiment was conducted under reducing conditions and using Immunoblot Buffer Group 1." alt="Western blot shows lysates of EL-4 mouse lymphoblast cell line and CTLL-2 mouse cytotoxic T cell line (negative control). PVDF membrane was probed with 0.2 µg/mL of Goat Anti-Mouse PD-1 Antigen Affinity-purified Polyclonal Antibody (Catalog # AF1021) followed by HRP-conjugated Anti-Goat IgG Secondary Antibody (Catalog # HAF017). A specific band was detected for PD-1 at approximately 55 kDa (as indicated). This experiment was conducted under reducing conditions and using Immunoblot Buffer Group 1." class="big_thumb" />
 HAF007). A specific band was detected for PD-1 at approximately 33 kDa (as indicated). This experiment was conducted under reducing conditions and using Immunoblot Buffer Group 1." alt="Western blot shows lysates of human peripheral blood mononuclear cells (PBMC) untreated (-) or treated (+) with 1 µg/mL PHA for 5 days. PVDF Membrane was probed with 1 µg/mL of Human PD-1 Monoclonal Antibody (Catalog # MAB1086) followed by HRP-conjugated Anti-Mouse IgG Secondary Antibody (Catalog # HAF007). A specific band was detected for PD-1 at approximately 33 kDa (as indicated). This experiment was conducted under reducing conditions and using Immunoblot Buffer Group 1." class="big_thumb" />
 1019-B7) binds with an ED50 of 0.16-0.8 µg/mL." alt="When Recombinant Mouse PD-1 Fc Chimera (Catalog # 1021-PD) is coated at 1 µg/mL, Recombinant Mouse B7-H1/PD-L1 Fc Chimera (Catalog # 1019-B7) binds with an ED50 of 0.16-0.8 µg/mL." class="big_thumb" />
 HAF018). Specific bands were detected for PD-1 at approximately 40-80 kDa (as indicated). This experiment was conducted under reducing conditions and using Immunoblot Buffer Group 1." alt="Western blot shows lysates of HEK293 human embryonic kidney cell line either mock transfected or transfected with human PD-1. PVDF membrane was probed with 1 µg/mL of Mouse Anti-Human PD-1 Monoclonal Antibody (Catalog # MAB10861) followed by HRP-conjugated Anti-Mouse IgG Secondary Antibody (Catalog # HAF018). Specific bands were detected for PD-1 at approximately 40-80 kDa (as indicated). This experiment was conducted under reducing conditions and using Immunoblot Buffer Group 1." class="big_thumb" />


 HAF017). Specific bands were detected for PD-1 at approximately 40-80 kDa (as indicated). This experiment was conducted under reducing conditions and using
  F0107) and Mouse Anti-Human CD3e APC-conjugated Monoclonal Antibody (Catalog #
  CTS008) and counterstained with hematoxylin (blue). Specific staining was localized to lymphocytes. View our protocol for

 AF1086) at 1ug/mL with overnight incubation at 4 degrees Celsius followed by incubation with anti-goat IgG VisUCyte HRP Polymer Antibody (Catalog #
 1086-PD) was serially diluted and captured by Goat Anti-Human PD‑1 Antigen Affinity-purified Polyclonal Antibody (Catalog # AF1086) coated on a Clear Polystyrene Microplate (Catalog #
  1086-PD) was serially diluted and captured by Goat Anti-Human PD‑1 Antigen Affinity-purified Polyclonal Antibody (Catalog #
 156-B7) binds with a typical ED50 of 0.15-0.75 µg/mL." class="big_thumb" />
 HAF017). A specific band was detected for PD-1 at approximately 75 kDa (as indicated). This experiment was conducted under reducing conditions and using
  Fluorescent IHC Staining of Frozen Tissue Sections." class="big_thumb" />
 CTS008) and counterstained with hematoxylin (blue). Specific staining was localized to cytoplasm in splenocytes. View our protocol for
  VC004). Before incubation with the primary antibody, tissue was subjected to heat-induced epitope retrieval using Antigen Retrieval Reagent-Basic (Catalog #


 F0108). View our protocol for
 ![Western Blot: PD-1 Antibody [NBP1-77276] - THP-1 cell lysate with PD-1 antibody at 1 ug/mL in the (A) absence and (B) presence of blocking peptide.](http://images.novusbio.com/fullsize/PD-1-Antibody-Western-Blot-NBP1-77276-img0005.jpg "Western Blot: PD-1 Antibody [NBP1-77276] - THP-1 cell lysate with PD-1 antibody at 1 ug/mL in the (A) absence and (B) presence of blocking peptide.")
![Immunocytochemistry/Immunofluorescence: PD-1 Antibody [NBP1-77276] - Human Brain tissue with PD-1 antibody at 20 ug/mL.](http://images.novusbio.com/fullsize/PD-1-Antibody-Immunocytochemistry-Immunofluorescence-NBP1-77276-img0009.jpg)
![Immunohistochemistry: PD-1 Antibody [NBP1-77276] - Staining of human tonsil tissue with antibody at 5 ug/mL.](http://images.novusbio.com/fullsize/PD-1-Antibody-Immunohistochemistry-NBP1-77276-img0008.jpg)
![Immunohistochemistry-Paraffin: PD-1 Antibody [NBP1-77276] - Human brain tissue with PD-1 antibody at 2.5 ug/mL.](http://images.novusbio.com/fullsize/PD-1-Antibody-Immunohistochemistry-Paraffin-NBP1-77276-img0004.jpg)
![In vitro inhibition by the CH-4 analog of the PD-1/PD-L1 interaction. (A) HEK293 cells (left-hand panel) and Jurkat cells (right-hand panel) were treated with CH-4.7 or CH-4.9 to test cytotoxicity. Cells were seeded into 96-well plates at a density of 7 × 10³/well and incubated overnight, then treated with increasing concentrations of CH-4.7 or CH-4.9 (0, 10, 20, 40, 80, or 100 uM) for 48 h. At 48 h, cell cytotoxicity WST-1 assays were performed. The x-axis indicates treatment concentrations, while the y-axis indicates the percentage of cell viability (each absolute absorbance value [abs. 450 nm–630 nm] was normalized with the controls). (B) The capacities of CH-4.7 and CH-4.9 to inhibit the PD-1/PD-L1 interaction were tested by the flow cytometry assay. The graphs present the mean +/- SD (standard deviation) values from at least three independent experiments. (C) CH-4.7 cytotoxicity in KG-1 cells. (D) Flow cytometry determined binding of the Ni–NTA-l-labeled sPD-L1 (PD-L1-Atto) complex to KG-1 cells expressing PD-1. Cell staining (FITC-subset) was blocked in the presence of CH-4.7. The experimental groups are indicated as (a) KG-1/PBS, (b) KG-1/Atto dye, (c) KG-1/sPD-L1/Atto dye, (d) KG-1/sPD-L1/Atto dye/CH-4 (10 uM), (e) KG-1/sPD-L1/Atto dye/CH-4.7 (20 uM). (E) The cell staining data from (D) are normalized and quantified as relative MFI values. (F) At 48 h, PD-1 protein (20 ug/well) expression was determined by Western blotting. The bar graphs present the mean +/- SD (standard deviation) values from three independent experiments. *p < 0.05, **p < 0.01, ***p < 0.001. Image collected and cropped by CiteAb from the following open publication (//pubmed.ncbi.nlm.nih.gov/34996924), licensed under a CC-BY license. Not internally tested by Novus Biologicals.](http://images.novusbio.com/fullsize/nbp1-77276_rabbit-polyclonal-pd-1-antibody-western-blot-132202613302222.jpg)


![N/A PD-1 [Biotin]](http://images.novusbio.com/fullsize/elisa/PD1_DY1086_ELISA_1568.jpg "N/A PD-1 [Biotin]")

 8986-PD) is immobilized at 1 µg/mL (100 µL/well), the concentration of recombinant human PD-L1 (B7-H1) Fc Chimera (
 156-B7) was immobilized on a Biacore Sensor Chip CM5, and binding to Recombinant Human PD-1 His protein (Catalog # 8986-PD) was measured at a concentration range between 6.0 nM and 3.05 uM. The double-referenced sensorgram was fit to a 1:1 binding model to determine the binding kinetics and affinity, with an affinity constant of KD=1.70 uM." class="big_thumb" />
 1224-PL) was immobilized on a Biacore Sensor Chip CM5, and binding to Recombinant Human PD-1 His protein (Catalog # 8986-PD) was measured at a concentration range between 6.0 nM and 3.05 uM. The double-referenced sensorgram was fit to a 1:1 binding model to determine the binding kinetics and affinity, with an affinity constant of KD=0.274 uM." class="big_thumb" />
 AVI9049) was immobilized on a Biacore Sensor Chip CM5 via the Avi-tag biotin, and binding to Recombinant Human PD-1 His protein (Catalog # 8986-PD) was measured at a concentration range between 3.2 nM and 13.2 µM. The double-referenced sensorgram was fit to a 1:1 binding model to determine the binding kinetics and affinity, with an affinity constant of KD=1.122 µM." class="big_thumb" />
![Immunohistochemistry-Paraffin: PD-1 Antibody [NBP1-88104] - Staining in human lymph node and liver tissues . Corresponding PDCD1 RNA-seq data are presented for the same tissues.](http://images.novusbio.com/fullsize/PD-1-Antibody-Immunohistochemistry-Paraffin-NBP1-88104-img0017.jpg "<b>Orthogonal Strategies Validation. </b>Immunohistochemistry-Paraffin: PD-1 Antibody [NBP1-88104] - Staining in human lymph node and liver tissues . Corresponding PDCD1 RNA-seq data are presented for the same tissues.")
![<b>Orthogonal Strategies Validation. </b>Immunohistochemistry-Paraffin: PD-1 Antibody [NBP1-88104] - Staining of human lymph node shows strong cytoplasmic positivity in germinal center cells.](http://images.novusbio.com/fullsize/PD-1-Antibody-Immunohistochemistry-Paraffin-NBP1-88104-img0015.jpg)
![Immunohistochemistry-Paraffin: PD-1 Antibody [NBP1-88104] - Staining of human liver shows no positivity in hepatocytes as expected.](http://images.novusbio.com/fullsize/PD-1-Antibody-Immunohistochemistry-Paraffin-NBP1-88104-img0018.jpg)
![Immunohistochemistry-Paraffin: PD-1 Antibody [NBP1-88104] - Staining of human placenta shows no positivity in trophoblastic cells as expected.](http://images.novusbio.com/fullsize/PD-1-Antibody-Immunohistochemistry-Paraffin-NBP1-88104-img0019.jpg)
![Immunohistochemistry-Paraffin: PD-1 Antibody [NBP1-88104] - Staining of human tonsil shows strong cytoplasmic positivity in germinal center cells.](http://images.novusbio.com/fullsize/PD-1-Antibody-Immunohistochemistry-Paraffin-NBP1-88104-img0016.jpg)

![Western Blot: PD-1 Antibody (7A11B1) [NBP1-75518] - A-20 cell lysate with PD-1 antibody at 1 ug/mL in the (A) absence and (B) presence of blocking recombinant protein.](http://images.novusbio.com/fullsize/PD-1-Antibody-7A11B1-Western-Blot-NBP1-75518-img0006.jpg "Western Blot: PD-1 Antibody (7A11B1) [NBP1-75518] - A-20 cell lysate with PD-1 antibody at 1 ug/mL in the (A) absence and (B) presence of blocking recombinant protein.")
![Immunohistochemistry: PD-1 Antibody (7A11B1) - BSA Free [NBP1-75518] - Immunohistochemistry of PD-1 in mouse brain tissue with PD-1 antibody at 2.5 u/mL.](http://images.novusbio.com/fullsize/nbp1-75518_mouse-monoclonal-pd-1-antibody-7a11b1-271120242022929.jpg)
![Immunocytochemistry/ Immunofluorescence: PD-1 Antibody (7A11B1) - BSA Free [NBP1-75518] - Immunofluorescence of PD-1 in human spleen tissue with PD-1 antibody at 20 u/ml.<br><br>Green: PD-1 Antibody [7A11B1] <br> Blue: DAPI staining](http://images.novusbio.com/fullsize/nbp1-75518_mouse-monoclonal-pd-1-antibody-7a11b1-2711202420441127.gif)
![Immunohistochemistry: PD-1 Antibody (7A11B1) - BSA Free [NBP1-75518] - Immunohistochemistry of PD-1 in human spleen tissue with PD-1 antibody at 25 u/ml.](http://images.novusbio.com/fullsize/nbp1-75518_mouse-monoclonal-pd-1-antibody-7a11b1-27112024204569.gif)
![Immunocytochemistry/ Immunofluorescence: PD-1 Antibody (7A11B1) - BSA Free [NBP1-75518] - Immunofluorescence of PD-1 in mouse brain tissue with PD-1 antibody at 20 u/mL.](http://images.novusbio.com/fullsize/nbp1-75518_mouse-monoclonal-pd-1-antibody-7a11b1-2711202420175132.jpg)
 F0101B) and Mouse Anti-Human CD3e PE-conjugated Monoclonal Antibody (Catalog #
  BT156) binds to HEK293 human embryonic kidney cell line transfected with human PD-1 and eGFP. (A) Binding is completely blocked by 2.5 µg/mL of Mouse Anti-Human PD-1 Monoclonal Antibody (Catalog # MAB10861) but not by (B) 2.5 µg/mL of Mouse IgG1 Isotype Control (


